



When it comes to trading, making the right decisions at the right time can mean the difference between profit and loss. One of the keys to successful trading is having a solid understanding of the indicators you use to guide your decisions. But even the best indicators won’t do you any good if they’re not optimized properly. In this article, we’ll explore the importance of optimization in trading indicators and how it can help you achieve greater success in the markets.
Cryptocurrency trading has become increasingly popular, and with it, the use of trading indicators to enhance decision-making processes. Among these indicators, In this blog post, we will delve into the optimization of Moving Averages for cryptocurrency trading, focusing on how to create an optimization script, the process of backtesting, and the limitations associated with it. Although the article focuses on cryptocurrencies, this approach can be applied to stocks, indices, commodities and other assets as long as you have the data and can identify an edge over the market.
By the time you made it to the end, you’ll have a solid understanding of how to optimize your trading strategies using Moving Averages and the potential pitfalls to avoid.




The main goal, as with all my articles on coding, data analysis and quant trading, is to spark your interest and give you the tools to follow your own path.
Why Optimization Matters?
Mathematical optimization is a powerful tool that can help traders achieve greater success in the markets by refining their strategies and making data-driven decisions. Optimization involves finding the best possible values for a set of parameters in order to maximize or minimize an objective function, such as profit or risk. In trading, this typically involves optimizing the parameters of technical indicators or trading algorithms in order to generate more accurate signals and improve trading performance. Optimization can be accomplished using a variety of methods, including manual trial-and-error, genetic algorithms, and machine learning techniques. By leveraging the power of optimization, traders can gain a competitive edge and increase their chances of success in the markets.
Each asset has its different characteristics, correlations, and factors of influence under which the price action develops. Still, in most cases, you will be told that you should apply this or that technical indicator with the given settings for each asset you are trading. For example, the classic pairs of moving averages like 10/20, 20/50, 50/200. This is like having only three sizes for a pair of shoes for everyone.
Optimization is like going to a skilled tailor for a custom-made pair of shoes — just as the tailor takes precise measurements and crafts the shoes to fit your unique foot shape, optimization involves tailoring your trading indicators to your specific goals and market conditions, resulting in a strategy that is perfectly suited to your needs. And this is just the beginning of the journey, there are almost infinite ways to identify your individual advantage in the markets. The purpose of this article is to help you get started in your own quest to beat the markets with your own data for your own benefit.
The Concept of Moving Averages
But first things first. What is the main concept of Moving Averages and other trading indicators that you will stumble across if you start learning about technical analysis. If you are not fully familiar with a classic moving average strategy, do not leave me here, I will explain in a moment. I will also try to be as precise as possible on each and every step, because I am convinced that anyone can learn to code their own scripts and you can apply them to pretty much any aspect of your life to make things easier for you.
When we look at a price chart, we’re not just seeing numbers; we’re seeing the collective thoughts, perceptions, and reactions of all market participants. This information reflects everything available to the market, but it doesn’t always represent the truth—it can be wildly exaggerated or understated. This is why we sometimes witness seemingly irrational rallies or sudden, steep crashes. The sheer amount of data can be overwhelming, making it difficult for any one person to fully grasp what’s happening. As humans, we naturally seek simplicity in the face of complexity. To help us make sense of the intricate movements in asset prices, indicators have been developed. These tools use clearly defined and coded rules to translate complex price trends into more understandable insights, guiding us in our decision-making.
For the purposes of this article, and for the sake of simplicity, I have chosen to use moving averages. Moving Averages (MAs) stand out due to their simplicity and effectiveness in identifying trends. Moving Averages are among the most fundamental tools in technical analysis, used to smooth out price data and identify trends over a specified period. There are several types of Moving Averages, including Simple Moving Averages (SMA) and Exponential Moving Averages (EMA). SMAs calculate the average price over a set number of periods, giving equal weight to each period. In contrast, EMAs give more weight to recent prices, making them more responsive to recent price changes. Within the script we will apply the simple moving average, but you can easily alter the script to be applied to e.g. EMAs.
The significance of MAs lies in their ability to help traders identify trends, reversals, and potential buy or sell signals. The most common applications of moving averages are the intersection of two moving averages of different lengths, or the position of the price relative to the moving average. Commonly used MA pairs, such as the 50-day and 200-day MAs, can indicate bullish or bearish trends when they cross each other. This crossover strategy is a staple in many trading systems due to its simplicity and this basic strategy is the one we will apply here.
Requirements and Prerequisites
If you’re interested in using the script yourself, the first step is to make sure you have Python installed on your computer. Alternatively, you can use a service like Jupyter Notebook. Personally, I prefer using Kaggle for developing new scripts. Kaggle offers a robust platform for data science and exploration, supporting Python and other languages. It comes with many commonly used libraries, such as Pandas and Numpy, already preinstalled. If you need additional libraries, you can easily install them as needed. Ultimately, the choice of platform is up to you—go with whatever suits your workflow best.
Now, what else do we need before we dive into the script? Here are the libraries we’ll be using:
- yFinance – An unofficial API to collect financial data from Yahoo Finance – if you want learn the basics of yFinance see my article here.
- Pandas – The go to Python data analysis library
- NumPy – A library that helps us to work with arrays of data
Matplotlib and Seaborn (optional) – If we want to visualize our results as an outcome of our analysis
Fine-Tuning Moving Averages for Bitcoin
Before we FINALLY get started, let’s take a quick look at the to-do list we need to tick off in order to get the optimization up and running; this list can pretty much be implied for any optimization problem you want to solve, and it always starts with getting your hands on the data.
- Data Collection and Preprocessing:
- Obtain historical price data for the chosen cryptocurrencies from yFinance.
- Clean and preprocess the data, ensuring it is free from errors and gaps.
- Setup the Moving Averages and Backtest Algorithm:
- Adding the Simple Moving Average (or other variants) to your script
- Incorporate the trading rules and conditions, in our case, whenever the shorter moving average crosses above the longer moving average, the buy condition is fulfilled, and vice versa, when the shorter moving average crosses below the longer moving average, we close the position and the profit or loss is calculated based on our entry and exit.
- Optimization Algorithm:
- Implement an optimization algorithm to evaluate various different MA pairs, of course based on our input for lengths of the average.
- Use the cumulative returns over the given time period to determine the best performing pair and display the results.
The optimization script automates the tedious process of manually testing different MA pairs, making it easier to identify the best combinations for trading strategies. Remember that the more historical data we use and the more different assets we want to optimize the model on, the longer it will take to run the script. It may take a while.
Let’s Dive into the Code – Step-by-Step:
If you are using kaggle you need install yFinance
!pip install yfinanceNext we import all necessary libraries
import yfinance as yf
import pandas as pd
import numpy as np
Depending on what asset you would like to optimize the moving averages for, you determine the ticker and feth the historical price data, in the given code we feth the price data for Bitcoin in a daily interval and for a many periods as possible.
ticker = 'BTC-USD'
df = yf.download(ticker, period = "max", interval = "1d" )
Let’s have a quick look on the output of that, by calling “df” or “print(df)”.

Next, let’s calculate the results of a simple buy-and-hold strategy to use as our benchmark for optimization. We’ll do this by computing the cumulative percentage change across the entire dataset. If you prefer a quicker approach, you can simply compare the first and last closing prices by dividing them. Either way, this will provide us with a solid reference point for our later comparisons.
 # Calculate the Buy & Hold
bh = (df.Close.pct_change() +1).prod()
In the following line we will integrate the two moving averages into our script.
# Function for Simple Moving Average
def ma_calc(n, m):
    df['sma_1'] = df.Close.rolling(n).mean()
    df['sma_2'] = df.Close.rolling(m).mean()
Now, let’s dive into creating the backtest function. This is where we define the rules for when our script should open or close a position. Remember, as we discussed earlier, we’ll open a position when the short moving average crosses above the long moving average, and we’ll close it when the opposite occurs. To make this work, we need to shift the next day’s opening price back by one period and create a new column called “price”.
# Create a new column in the dataframe
df['price'] = df.Open.shift(-1)
#Backtest Function
def backtest(df, n, m):
ma_calc(n, m)
in_position = False #States that we are not in a position at the beginning
profits = []
for index,row in df.iterrows():
if not in_position:
if row.sma_1 > row.sma_2:
buyprice = row.price
in_position = True
if in_position:
if row.sma_1 < row.sma_2:
profit = (row.price - buyprice)/buyprice
profits.append(profit)
in_position = False
gain = (pd.Series(profits)+1).prod()
return gainWith our groundwork in place, the next step is to define the different pairs of moving averages we want to include in our optimization process. To do this, we’ll create two new data frames. These will specify the starting values, the ending values, and the incremental steps the script should take between those values.
#Setting the Moving Average values from 10 to 205 with steps of 5 for each pair
x = pd.DataFrame(np.arange(10,255,10))
y = pd.DataFrame(np.arange(10,255,10))
Then we cross join all the values in order to get a comprehensive list of all possible combinations.
# Cross Join of the two dataframes generates all combination of the given numbers
final = pd.merge(x,y, how='cross')
final.columns = ['sma_1', 'sma_2']
Excluding all combinations where the length of the two moving averages are identical.
# Exclude all rows where SMA1 = SMA2
final = final[final.sma_1 != final.sma_2]
Now it is time for the actual optimization and we create a loop what running through all pairs, running our backtest function, printing the results and storing them in lists.
# Creating list for the results and the different lengths of the indicator pairs
result = []
parameter1 =[]
parameter2 =[]

# Looping through each pair backtesting for the results
for n, m in final.values:
    print('parameter: '+ str(n) + '/' + str(m))
    print(backtest(df,n, m))
    result.append(backtest(df,n, m))
    parameter1.append(str(n))
    parameter2.append(str(m))
As we have all the results caculated we store them in a data series and combine them in a data frame.
results = pd.Series(result, name='Results')
parameters1 = pd.Series(parameter1, name='SMA1 Length')
parameters2 = pd.Series(parameter2, name='SMA2 Length')
Let’s have a look at the best performing pair for Bitcoin in the daily interval between 2014 and the data of writing this article.
# Store the data in a list
d1=pd.concat([parameters1, parameters2,results],axis=1)
d1. loc[d1['Results']. idxmax()]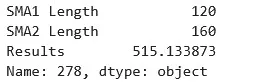
Based on the variables we set, the most effective moving average pair appears to be the 120-day and 160-day averages. This combination achieved an impressive cumulative return of 515.13%. In comparison, our simple buy-and-hold strategy would have increased our initial investment by ‘only’ 139 times.
To make our results even more compelling, let’s visualize the top-performing pairs alongside the Buy & Hold strategy. For this, I’ve chosen to use a bar chart. Since I often share insights on social media (though I’m not sure what to call it now that it’s been renamed from Twitter), I’ll also show you some tips to make your charts more visually appealing.
First, we need to identify the top 20 best-performing pairs.
d1 = d1.nlargest(20, 'Results')
d1['SMA_Cross'] = 'MA Cross ' + d1['SMA1 Length'].astype(str) + ' / ' + d1['SMA2 Length'].astype(str)
Next, we’ll use Matplotlib and Seaborn to create our bar chart and visualize the top-performing moving average pairs. Since the focus of this post is on the optimization process, I won’t dive deeply into the details of chart creation here, to save your time.
import seaborn as sns
import matplotlib.pyplot as plt

fig, ax = plt.subplots(figsize=(30, 10))
graph = sns.barplot(data=d1, x="SMA_Cross", y="Results",palette=sns.light_palette("#0097b2", n_colors=len(d1), reverse=True) )
#ax.set_title('Most Profitable Moving Average Cross Pairs for '+ ticker)

# Removing the axis titles
ax.set(xlabel='', ylabel='')

# Removing the spines
ax.spines['top'].set_visible(False)
ax.spines['left'].set_visible(False)
ax.spines['bottom'].set_visible(False)

# Making the right spine thicker
ax.spines['right'].set_linewidth(1.1)

# Adding the blue line and rectangle
fig = plt.gcf()
ax.plot([0.12, 0.9], [0.98, 0.98], transform=fig.transFigure, clip_on=False, color='#0097b2', linewidth=0.6)
ax.add_patch(plt.Rectangle((0.12, 0.98), 0.04, -0.02, facecolor='#0097b2', transform=fig.transFigure, clip_on=False, linewidth=0))

# Adding the title and subtitle
ax.text(x=0.12, y=0.93, s="Moving Average Cross Pairs for "+ ticker, transform=fig.transFigure, ha='left', fontsize=20, weight='bold', alpha=0.8)
ax.text(x=0.12, y=0.90, s="Optimization model for the most profitable pair of Moving Averages for the 1 Day time interval based data reaching back to January 1999", transform=fig.transFigure, ha='left', fontsize=14, alpha=0.8)

# Setting a white background
ax.patch.set_facecolor('white')

# Adding small text in the bottom right corner
ax.text(x=0.90, y=0.05, s="Created by Coinphlip", transform=fig.transFigure, ha='right', fontsize=8, color='grey', alpha=0.7)

# Save the figure with a white background
plt.savefig(f'Moving_Average_Pair_{ticker}.png', bbox_inches='tight', facecolor='white')

ax.bar_label(ax.containers[0])
#plt.tight_layout()
plt.xticks(rotation=-45)
graph.axhline(bh, color='r', linestyle='--', label = 'Buy & Hold')
plt.legend(loc = 'upper right')
plt.show()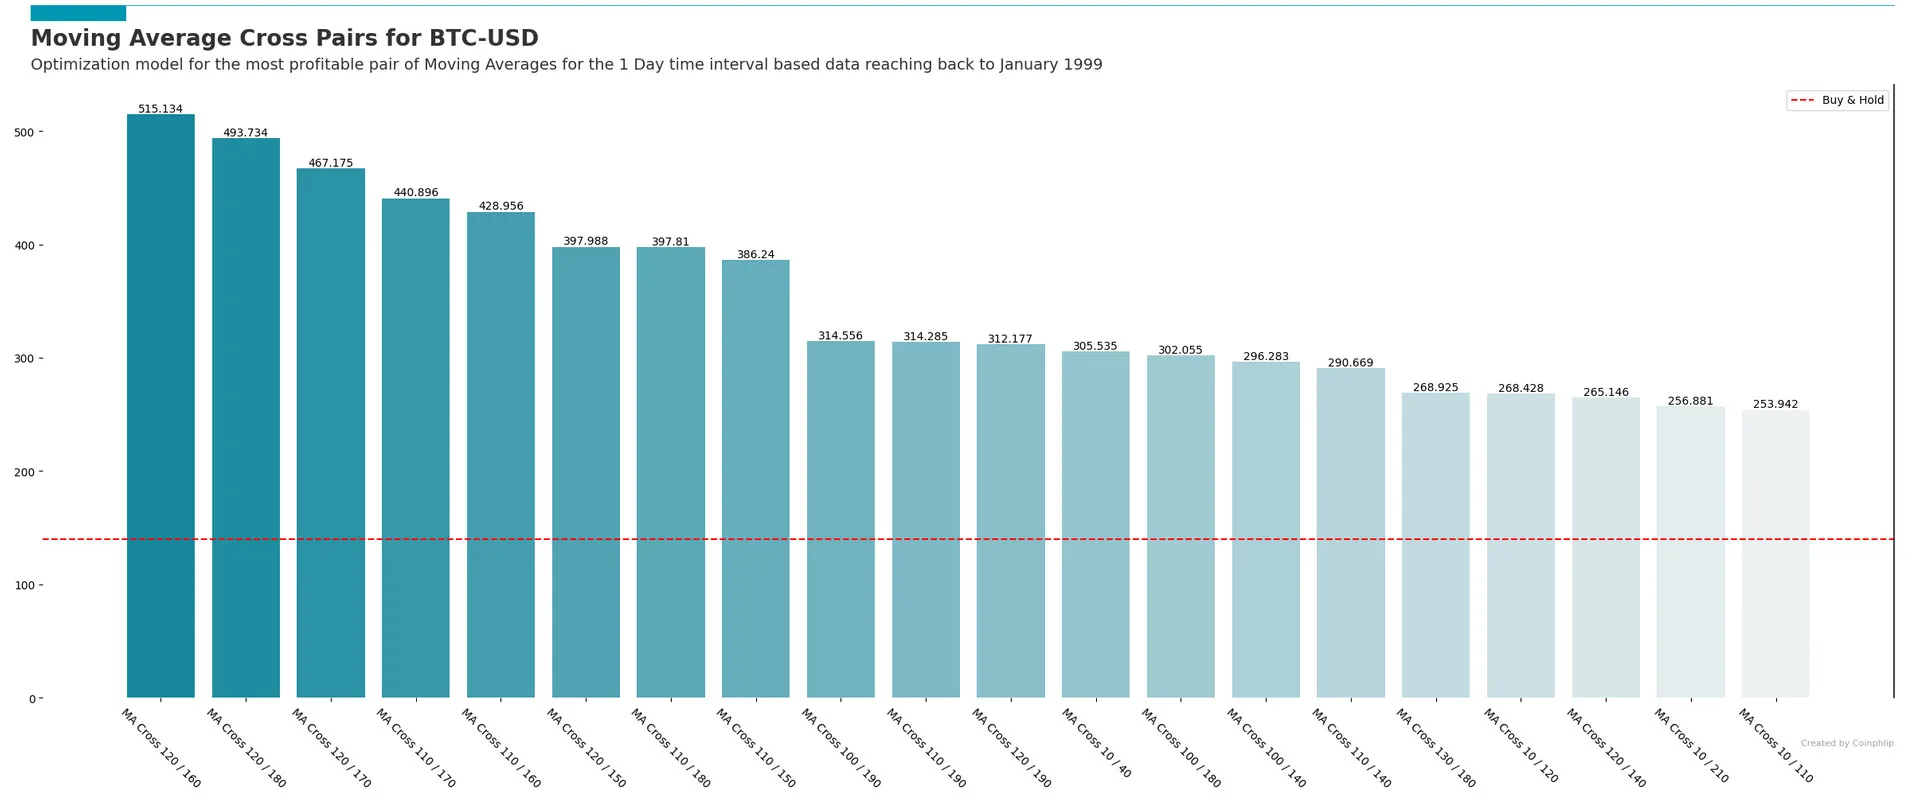
We’ve successfully created our optimization script to identify the most effective moving average pairs for Bitcoin trading on the daily timeframe, and we’ve visualized the results. As we can see, several pairs significantly outperformed the simple buy-and-hold strategy.
But does this mean you should invest all your money in the top-performing pairs for an asset? The short answer is no. The longer explanation is covered in the next section.
Practical Considerations for Traders
While the optimization of Moving Averages can significantly enhance trading strategies, it’s important to remember that it’s not without its pitfalls. Let’s talk about a few potential downsides and shortcomings that you should keep in mind when interpreting your backtest results.
Slippage
First up, let’s discuss slippage. In our backtest, we often assume that trades are executed at the exact price our strategy suggests. However, in the real world, things aren’t always that smooth. The market can move between the time you decide to trade and the moment your trade actually goes through. This difference, known as slippage, can lead to less favorable entry or exit points, ultimately eating into the profits that looked so promising in our backtest.
Tradings Fees
Next, we need to consider trading fees. When we run a backtest, it’s easy to overlook the impact of broker fees, commissions, and spreads. But in reality, these costs can add up quickly, especially if your strategy involves frequent trading. What might seem like a winning strategy on paper could turn out to be much less profitable once you factor in these fees. So, it’s crucial to account for trading costs when evaluating your backtest results.
Taxes and Regulations
Let’s not forget about taxes and regulations. Depending on where you’re trading, capital gains taxes, transaction taxes, and other regulatory requirements can significantly reduce your net returns. Plus, some strategies might be restricted or even prohibited in certain regions. In our backtest, we might not fully account for these legal and tax implications, which can make a big difference in the real world.
Hindsight Bias
First, let’s talk about hindsight bias. When we backtest a strategy, we’re using historical data that’s already known. This knowledge can unconsciously influence our decisions, leading us to design strategies that work perfectly in the past but may not perform as well in the future. It’s easy to look back and see where the market moved in a particular direction and tailor our strategy accordingly. However, in real-time trading, we don’t have the luxury of knowing what will happen next. That’s why it’s crucial to remain aware of this bias and test your strategies in a way that reflects the uncertainty of live markets.
General Shortfalls of Backtesting
Beyond hindsight bias, there are other general shortcomings of backtesting that we should consider. For one, backtests often assume perfect market conditions—no slippage, no execution delays, and no unexpected news events that can shake the markets. But as you know, real-world trading is far more unpredictable. Backtesting also relies on historical data, and while history can be a useful guide, it doesn’t always repeat itself. Market conditions, regulations, and trader behavior can all change, making past data an imperfect predictor of future performance.
Moreover, backtests may not account for the psychological factors that come into play during live trading. It’s one thing to see a strategy perform well on paper, but quite another to stick with it through periods of drawdown or volatility when real money is on the line. The emotional aspect of trading is something no backtest can simulate.
Conclusion
In this blog post, we’ve delved into the optimization of Moving Averages for cryptocurrency trading, walking through the creation of an optimization script, discussing the benefits and limitations of backtesting, and highlighting key considerations for traders. By grasping and applying these concepts, you can refine your trading strategies and enhance your chances of success in the ever-changing cryptocurrency market.
As you integrate optimized MA pairs into your trading systems, remember that ongoing monitoring is essential. Don’t rely solely on the initial results—stay flexible and be prepared to adjust your strategy as market conditions evolve. The market is dynamic, and strategies that work well today may not be effective tomorrow. To keep your strategy relevant and profitable, regularly re-optimize your MA pairs and backtest them with fresh data.
By staying proactive and adaptable, you can ensure your trading strategy remains robust in the face of market volatility.
Change is the only constant in life – Heraclitus
What’s Next? Expanding Your Strategy Optimization
Now that we’ve developed a script to optimize a moving average cross strategy for Bitcoin, the possibilities for further exploration are endless. Here are a few ideas on what we can tackle next:
Optimize Across Multiple Assets: Expand your optimization efforts to include a variety of cryptocurrencies or even other asset classes. This way, you can identify which strategies work best across different markets and conditions.
Explore Different Intervals: Test your strategy on different timeframes, such as hourly or weekly charts, to see how the results vary. This can help you find the optimal settings for various trading styles, whether you’re day trading or holding positions longer term.
Experiment with Different Indicators: Moving averages are just one type of indicator. You could explore other indicators like RSI, MACD, or Bollinger Bands, and even combine them to develop a more robust strategy.
Identify Biases or Shortfalls: Take a closer look at potential biases or shortcomings in your approach, such as overfitting to historical data. Understanding these pitfalls can help you create strategies that are more resilient in live trading.
We’d love to hear about your experiences and strategies—please share them in the comments below! If you have any questions or need further assistance, don’t hesitate to reach out. And be sure to subscribe to our blog for more updates and insights on trading strategies and indicator optimization.
Let’s continue pushing the boundaries of what’s possible in trading strategy development together!
References and Further Reading
By leveraging the knowledge and tools discussed in this post, you can develop more effective and adaptive trading strategies, ultimately enhancing your performance in the cryptocurrency market.




I was recommended this website by my cousin I am not sure whether this post is written by him as nobody else know such detailed about my difficulty You are wonderful Thanks
I do not even know how I ended up here but I thought this post was great I dont know who you are but definitely youre going to a famous blogger if you arent already Cheers
Başakşehir su kaçak tespiti Profesyonel bir ekip, su kaçağını hemen çözdüler. https://rapagram.com/ustaelektrikci